Cryptocurrency gained the main popularity due to the innovativeness of its technology. But it is difficult to deny the fact that many investors pay attention to it as a financial instrument for making a profit. In this connection, the question arises: how to trade correctly? The answer is simple - one needs to be able to analyze the market. Only by understanding how to predict a trend, a trader can make good money.
To predict the price movement of Bitcoin or other cryptocurrencies, it is essential to do it with Technical Analysis (TA), which is why in this article we will turn to its basics but, first of all, let us briefly recall the main steps that are required for trading cryptocurrency on the Emirex or any other exchange:
- Choose cryptocurrency and analyze the market (expert predictions, assets behavior over time, growth prospects, etc).
- Bear in mind all possible risks.
- Decide how to store your crypto: exchange or personal wallet.
- Choose a trading strategy: a long investment or speculative trading on short positions.
Definition
Technical Analysis is a set of tools with which you can predict how the price of an asset will change in the future. Its chart is examined to identify patterns and volume of trading so it becomes clearer who dominates the market: sellers (bears) or buyers (bulls). This is especially important for the volatile cryptocurrency market, but at the same time, the analysis system is quite young and the TA base for cryptocurrencies is not yet well developed.
The analysis is based on three main indicators of the charts:
- Support and resistance levels (trend lines)
The support level is the price level at which most traders agree to buy cryptocurrency since they believe that the indicated price is lower than it actually is. At this point, a large number of players start buying a large amount of cryptocurrency at a low price.
The resistance level has a similar purpose. But, if at the support level traders buy the currency, then when the resistance level is reached, they sell it, because they believe that the price has risen higher than it actually is.
The market is sensitive to changes in the level of supply and demand. The price begins to fluctuate up and down - between the levels of support and resistance, forming a price channel. This can go on for a long time. But, in the case when the price overcomes one of the levels, the level of trading activity increases.
- RSI - trend strength indicator
It is a tool that displays the strength of a price trend. It indicates the intensity of buying and selling an asset and is considered one of the most effective analytical tools for assessing the status of a cryptocurrency. Traders who use the indicator correctly get the opportunity to conduct a detailed analysis of the digital money trend and build reliable forecasts of price changes on its basis.
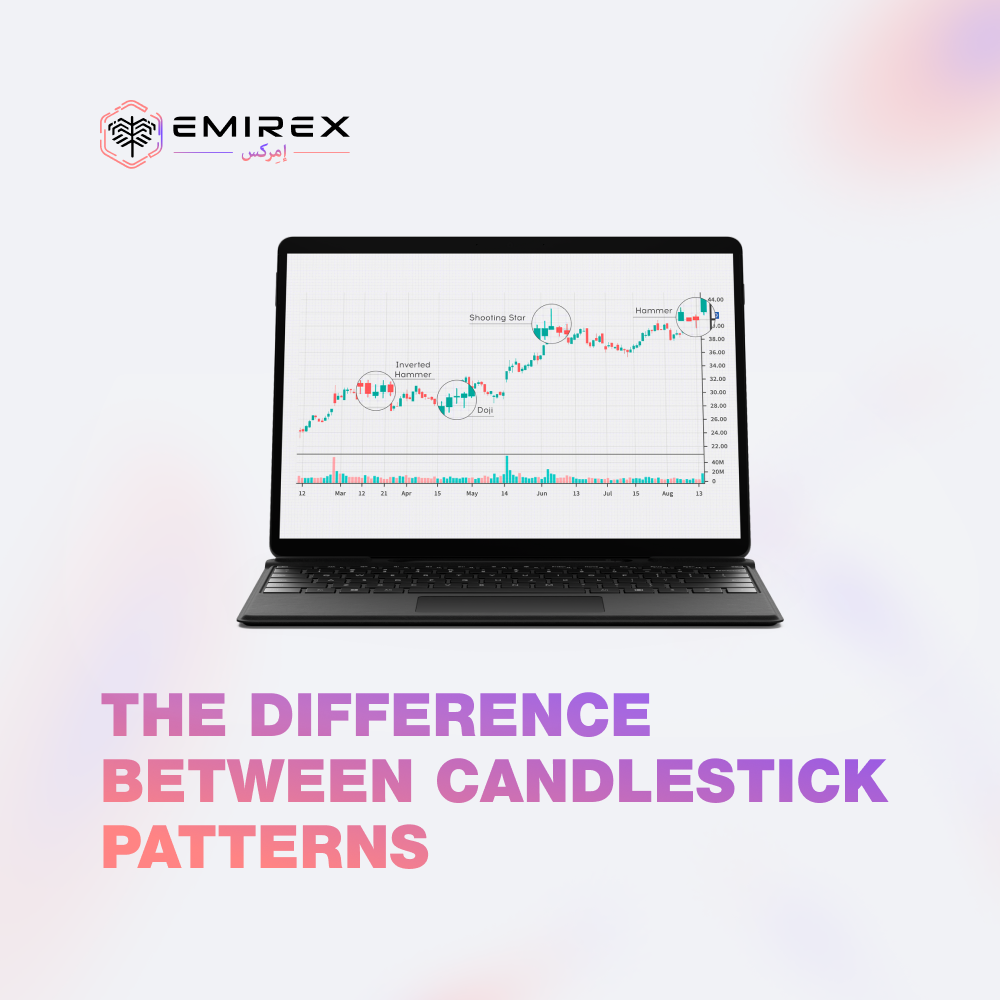
- Chart patterns (Flags, Double Top/Bottom, Head & Shoulders, etc.)
TA patterns are the most accessible tools on the chart that can be easily identified by traders in the movement of cryptocurrency quotes. They describe a change in the price of a crypto instrument that traders notice over and over again on the chart. Based on repeating, similar patterns, over time, one can learn to make predictions about future movement.
Studying these basics in detail and applying them properly in practice is a successful start for a novice trader in the market.
How much a TA may bring?
Naturally, you would like to know specific numbers, but in this case, a trader's earnings depend solely on his experience, actions, and capital.
Profit is on average 10% of the amount per day. And trading transactions for 25-50 thousand dollars are quite common for large exchanges, but for a start, you can limit yourself to the minimum amount. In general, 6% of the deposit per day is far from the worst indicator.
Today, crypto trading is considered one of the most promising types of activity that allows you to make money both on the growing rate and decline.
Closing line
The difficulty of applying Technical Analysis (TA) in cryptocurrencies is that the market is young and not yet fully formed: the physical usefulness of cryptocurrency platforms has not been determined, issues with regulators have not been resolved, etc. Therefore, the psychology of the market remains an important factor influencing the quotes.
As a rule, the rates are controlled by certain groups of large players, who are capable of increasing traded volumes in an instant. And yet, many participants successfully apply a certain number of Technical Analysis elements to predict price movements. To this end, they use only basic tools and simple approaches that are easier to interpret.