


What Exactly Is a Hammer Candlestick?
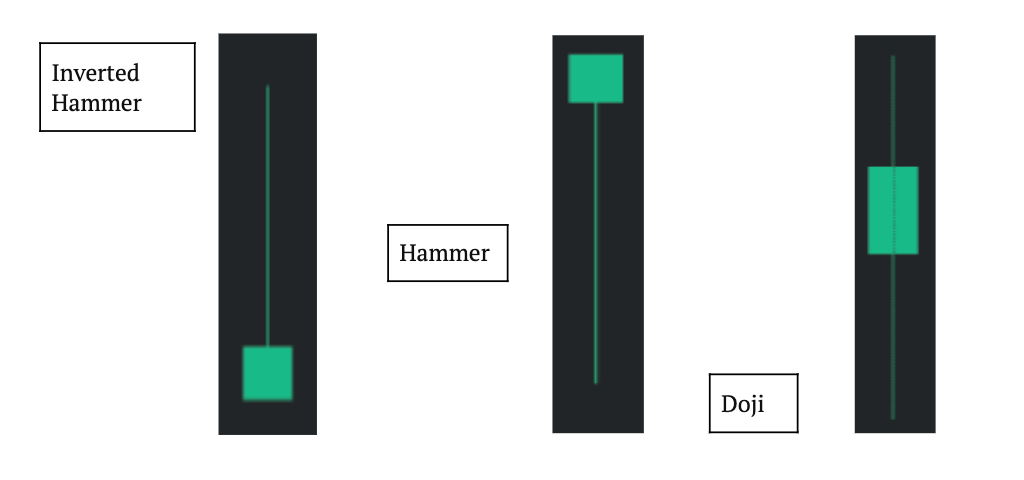
In candlestick charting, a hammer is a price pattern that happens when an asset trades considerably lower than its initial price, but rallies during the period near the opening price. This pattern yields a hammer-shaped candlestick with a bottom shadow at least twice the size of the actual body. The difference between the open and closing prices is represented by the body of the candlestick, while the high and low prices for the time are represented by the shadow.
What Is the Meaning of the Hammer Candlestick?
When a hammer appears, it is indicating that the market is trying to seek a bottom. Hammers suggest a probable surrender by sellers to create a bottom, which is accompanied by a price increase, indicating a possible price direction reversal. This occurs all at once, with the price falling after the open but regrouping to close around the open.
Hammers are most effective when at least three or more declining candles precede them. A declining candle is defined as one that closes lower than the previous candle's closing.
The shape of a hammer should resemble a "T." This means a hammer candle is possible. Until a price reversal to the upside is established, a hammer candlestick does not signify a price reversal.
Confirmation happens when the candle that follows the hammer closes above the hammer's closing price. This confirmation candle should ideally reflect significant purchasing. During or after the confirmation candle, candlestick traders will generally attempt to acquire long positions or exit short positions.
A stop-loss can be put below the bottom of the hammer's shadow for individuals entering fresh long positions. Even with confirmation, hammers are seldom used in isolation. To confirm candlestick patterns, traders generally use price or trend analysis, as well as technical indicators. Hammers are visible on all periods, including one-minute, daily, and weekly charts.
Using a Hammer Candlestick

A price fall (red) is followed by a hammer pattern on the chart. This pattern's lower shadow (yellow) was several times longer than the real body. The hammer signaled an impending upward price reversal.
Confirmation (orange) occurred on the next candle, which gapped higher before being bid up to a close far above the hammer's closing price. Traders generally enter the market to purchase during the confirmation candle. If the price is going aggressively upward during the confirmation candle, a stop loss is put below the hammer's low, or perhaps just below the hammer's true body.
What is a Doji?
Another form of the candlestick with a small actual body is the Doji. Because it features both an upper and lower shadow, a Doji represents indecision. Depending on the confirmation that follows, Dojis might indicate a price reversal or trend continuation. The hammer, on the other hand, appears after a price drop, suggests a probable upside reversal (if confirmed), and has just a long lower shadow.
Use of Hammer Candlesticks Has Its Limits
There is no guarantee that the price will continue to rise after the confirmation candle. A long-shadowed hammer and a strong confirmation candle may take the price rather high in two sessions. This might not be the best place to purchase because the stop-loss is a long way from the entry point, exposing the trader to a risk that isn't worth the possible return. Due to the lack of a price goal for hammers, calculating the possible return on a hammer transaction might be difficult. Other forms of candlestick patterns or analysis must be used to determine exits.
The Bullish Hammer Candlestick Pattern
The hammer candlestick is a bullish trading pattern that indicates a stock has reached its bottom and is about to reverse the trend. It indicates that sellers entered the market and drove down the price, only to be overwhelmed by buyers who drove the asset price up. The price reversal to the upward must be confirmed, which means the next candle must close above the hammer's previous closing price.
What's a Shooting Star Candlestick Pattern?
A shooting star candlestick pattern suggests a negative price trend, but a hammer candlestick pattern predicts a bullish reversal. Shooting star patterns emerge after a stock rises, suggesting an upper shadow. The shooting star candlestick is the complete opposite of the hammer candlestick in that it rises after opening but ends at about the same level as the trading period. The apex of a price trend is indicated by a shooting star pattern.

Should You Be Using Candlestick Patterns?
The short answer is maybe, these patterns come into view all the time, but regardless of that, crypto markets are highly volatile and prone to unexpected behavior. That’s one reason why experienced traders look at so many indicators before making their investments. Candlesticks are just one of those indicators that may help you in your trades, but they shouldn’t be your only one. Please keep in mind that this post is not financial advice, nor is it a suggestion to purchase or sell any cryptocurrency, or to engage in any trading or other activities. To make financial decisions, Emirex advises that you must always conduct your own research. Happy trading!


.png)