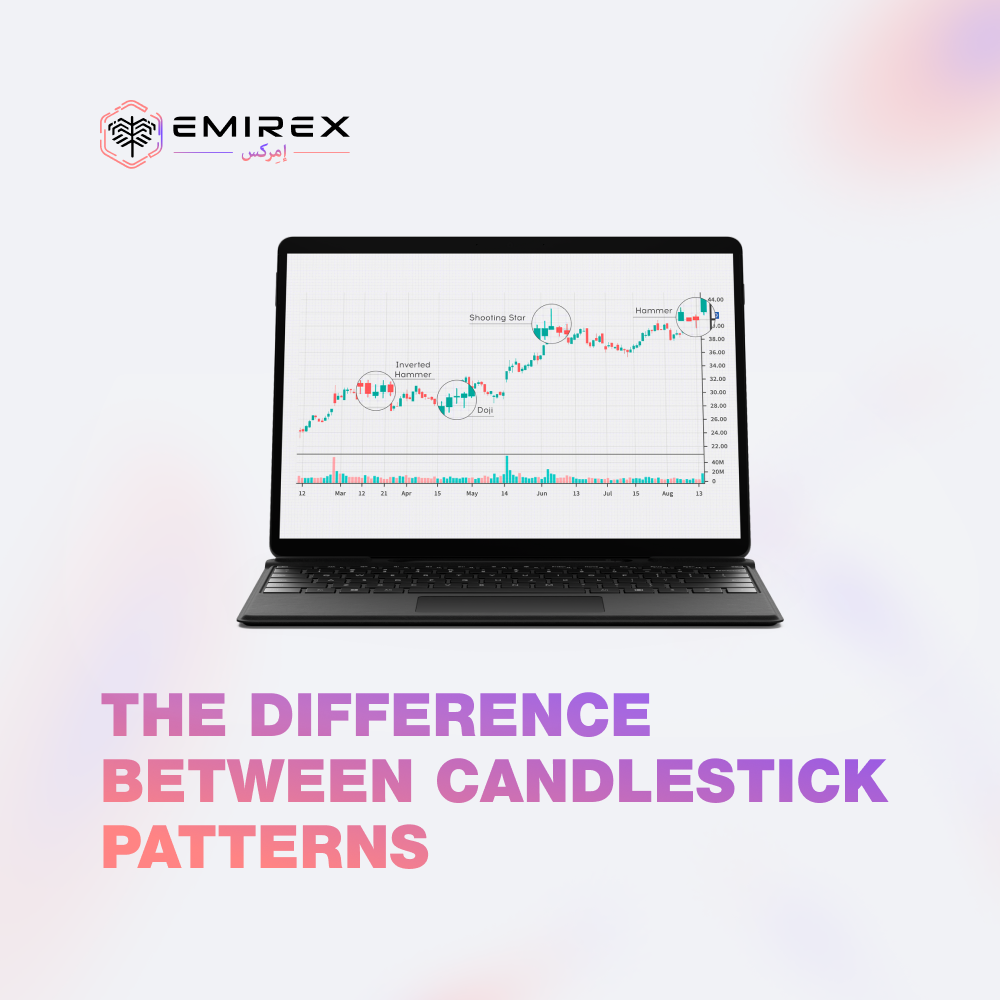
The practice of trading on the cryptocurrency market can bring a lot of valuable experience, especially with an integrated approach based on cold calculation, which excludes making impulsive and unreasonable decisions. In the list of contributing elements, in addition to Technical Analysis (TA), we also include Fundamental Analysis (FA), which will be covered today.
Both approaches are quite applicable to any market, and cryptocurrencies are no exception. On the other hand, this market still has some specifics. So, since the total capitalization of digital currencies is only growing, and the analysis methodology is in the process of being developed, the conjuncture of this market relies on big news, messages about the achievements of developers, and resonant statements of prominent economic and political figures like Elon Musk.
Fundamental Analysis of cryptocurrencies implies a deep dive into the available information about a financial asset. For example, you can consider its possible clients, the number of users, or the team behind the project. The goal is to conclude whether an asset is overvalued or undervalued. After that, the information obtained can be used when opening trading positions.
In this article, we'll go over the basics and try to define the metrics from which to build indicators.
Analysis features
Fundamental analysis is designed to assess the real value of an asset, to determine how much its price at the moment corresponds to the realities of the market.
Cryptocurrency news is released without a clear reference to any schedule or economic calendar. Thus, in the world of traditional finance, relatively regular news about GDP indicators, inflation, changes in the key rate, etc., has a significant impact on the market.
In the world of cryptocurrencies, everything happens much more spontaneously and unpredictably. This, in turn, makes it difficult to predict market trends and prices of individual coins for the mid and long term.
Before investing in one or another crypto asset, one should pay attention to many fundamental factors, including:
- The project team, its reputation, and background of key participants;
- Project roadmap describing mid and long-term development plans;
- The relevance of the problem that a particular project is designed to solve (demand for the product in the market);
- White paper availability;
- MVP availability and the degree of its readiness for mass use;
- Features of monetary policy: total and circulation supply, staking rewards, frequency of decreasing rewards by miners, etc.;
- Cryptocurrency capitalization, trading volume, price volatility;
- Transaction volume and average fees;
- Infrastructure development, partnerships, listings, etc.
Many crypto traders pay significant attention to news analysis. It often has a key influence on market sentiment. In terms of the growing capitalization of digital assets, news can greatly affect the rates of both individual cryptocurrencies and the entire market as a whole.
Popular Indicators & Ratios in FA
Indicators:
- Unique addresses (per day);
- Transaction volume (per day);
- Mining cost (per day).
Each of the indicators denotes a trend - uptrend, downtrend, or flat. If they rise, this is a bullish trend, if they decline, it is bearish. If they do not change significantly, the trend is neutral.
Ratios:
- NVT (Network Value to Transactions - the ratio of the network value to the transaction price) - a bullish trend when the ratio is below 10, bearish - when it is more than 25;
- MVRV (Market Value to Realized Value) - if the ratio is below 1.5, the asset is undervalued; the ratio is higher than 3.5 - the asset is overvalued;
- Mayer's multiplier - less than 1.0 - bullish trend, more than 2.4 - bearish trend;
- Mining ratio P/BE (Price to Breakeven, the price of an asset to the breakeven level of mining) - a ratio below 1.2 indicates a bullish trend, bearish - 3.2 or more.
Each of these metrics has two thresholds, an upper and a lower. Let's take a quick look at each of them.
- Number of unique active addresses per day
Unique addresses are another important basic indicator that shows how many people are using the network on any given day. We need this indicator to determine the trend. If the trend is upward and network usage increases, we can expect its value to increase. Consequently, if the number of unique addresses decreases, then the network utilization and its value are reduced.
- The volume of transactions in the network per day
Analyzing the number of unique user addresses gives you only half the picture of network activity. If you want to see it in its entirety to assess the network, you need to know how many transactions were made over a certain period. This indicator allows you to determine whether the total cost of all transactions in the network is growing, decreasing, or remains stable. If the daily volume of transactions increases, so does the value of the network and vice versa. This indicator is used to determine the trend, it is not used in the evaluation process. But the higher the volume of transactions on the network, the higher its cost.
- Mining costs
At the peak of the rate, you can pay a high cost for a confirmed transaction on the Bitcoin blockchain. However, as the rate of transaction fees falls, so does the level of online activity. The less activity in the network, the lower its cost, which characterizes the bearish indicator for bitcoin.
- Network value to transactions
One of the basic ratios used in the fundamental valuation of crypto assets is the network value to transaction price ratio. The value of the network, which is the equivalent of market capitalization in the world of securities, is divided by the number of transactions. This shows us the ratio of the cost of the entire network to its activity. If the cost of the network is very high, but there is a small activity on it, the NVT value will be high. If the network value of the crypto asset is medium and the network activity is high, the NVT value will be lower.
- Market Value to Realized Value
MVRV is a more specialized variant of the NVT ratio. It is the ratio of the market value of the network (market capitalization) to its realizable value. Realization value, in turn, is capitalization, where the coins and their price are based on the market price of bitcoin at the moment when each of the coins last participated in transactions on the blockchain. This cuts off lost coins and also determines the price level of the cumulative cost basis, which helps the investor to get an idea of the current level of price support based on the data on trading activity in the past. Lost coins distort the average calculation, and this coefficient is intended to correct this.
- Mayer’s multiplier
This is one of the most commonly used ratios after NVT. It is a statistic that takes into account how common the price level is concerning trading data for a period using a 200-day moving average. The Mayer multiplier value is determined by the following formula:
Mayer's multiple = Price / 200-day moving average
- P / BE ratio
This ratio shows the ratio of the price of a crypto asset to the cost of mining. Works only for coins that are mined, not suitable for assets with premining. It is most often used for the main crypto assets like Bitcoin and Ethereum.
For example, if Bitcoin is trading at $ 44,000 and the mining break-even point is at $ 47,000, the P / BE ratio will be 0.93 (44,000/47,000). If the value is below 1.2 - the trend is bullish, if it is above 3.2 - bearish.
Closing line
The proper application of Fundamental Analysis can provide invaluable insight into cryptocurrencies that Technical Analysis cannot provide. The ability to separate the market price from the “true” network value is an excellent trading skill. Of course, Technical Analysis has its advantages that Fundamental Analysis cannot predict. Therefore, the most appropriate option will be to use them in combination with each other.
As with many strategies, there is no universal Fundamental Analysis guide. We hope this article helped you understand some of the basic factors that will become the launchpad for your further development in the world of cryptocurrencies and will allow you to carry out successfully your trading activities on the exchange.


